Unreliable match predictions start with a conclusion and look for evidence afterwards.
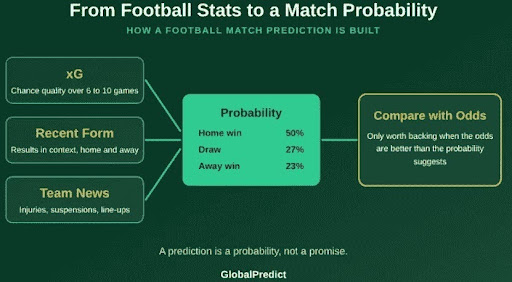
A good prediction goes beyond league position, since two teams with identical records can differ greatly in attacking strength, defensive weakness and chances of winning their next game. It starts with measurable inputs such as xG, recent form, home and away performance and player availability, and ends with a probability that is compared with the bookmaker’s odds.
Understanding these statistics lets you judge the evidence behind a tip and decide whether the outcome makes sense and the odds justify backing it.
Here is how it works
Expected Goals (xG): The Quality Behind Chances
Expected goals (xG) rates each shot’s chance of scoring based on distance, angle, body part and assist type. A team’s match xG is the sum of its chance values, and over 6 to 10 games it predicts future results better than actual goals.
Example values: tap-in about 0.85, penalty about 0.76, 30-yard shot about 0.03.
What to check over 6 to 10 games:
- xG difference: Above +0.5 per match means a team creates far more than it concedes.
- Low xG for: May reflect weak creativity, a cautious style or tough opponents.
- High xG against: The defence may be weaker than goals conceded suggests.
- Goals vs xG: Overperformers may regress and underperformers may improve, though finishers and goalkeepers vary.
xG measures chance quality, not the exact goals in the next match.
Recent Team Form: Looking Beyond Wins and Losses
A team’s last five results can be misleading. Wins against weak opponents don’t prove strong play and two defeats don’t prove poor play.
When assessing form, check:
- Opponent strength: Who the results came against.
- xG: Whether the team created and allowed quality chances.
- Goals and clean sheets: Whether they match xG, or whether finishing and goalkeeping explain the gap.
- Home and away form: Some teams differ sharply by venue, so assess each separately.
Bookmakers often react faster to results than to underlying performance, so a winning or losing run can move a team’s odds more than its actual play warrants.
Tactical Matchups: Why Playing Styles Matter
Statistics show what teams have achieved; tactical analysis shows how they might perform against a particular opponent. Two strong attacking sides can produce very different matches depending on their styles. Averages describe teams in general, but matches are specific, so ask how each side’s style interacts with the other’s.
Key matchups:
- High press vs build-up from the back: The pressing side can create high-quality chances from recoveries in dangerous areas, especially if the opposing goalkeeper or defenders are uncomfortable on the ball.
- Low block vs possession side: Expect many shots but low xG per shot, so games are often tight with few clear chances.
- Set-piece strength vs weakness: A team that often concedes from corners and free kicks is in trouble against one that scores a large share of its goals from them.
Injuries and Suspensions: Assessing the Impact of Missing Players
Player availability can significantly change a football prediction. Missing a first-choice centre-back raises expected goals against, missing main creator lowers expected goals for, and losing a goalkeeper who consistently outperforms expected shot-stopping can matter more than any outfield absence.
Confirmed injuries, suspensions, expected line-ups, recent rotation and players returning from injury.
Check line-ups as late as possible, ideally an hour before kick-off, and separate confirmed team news from rumours or predicted line-ups.
Worked Example: From xG to Probability
Football prediction is about probability. A prediction is not a promise, and it is only worth backing when the odds are better than the probability suggests.
For example, a hypothetical match analysis might estimate:
| Match Outcome | Estimated Probability |
| Home win | 50% |
| Draw | 27% |
| Away win | 23% |
The figures represent three possible outcomes and add up to 100%.
A 50% home-win probability makes the home side the favourite, but it still fails to win half the time. Probabilities also let bettors compare markets, so a game may have a stronger case for Over 1.5 Goals than for a home win.
Where GlobalPredict Fits
Understanding football stats is useful, but analysing several fixtures every day takes too long. You’d need to gather xG data, adjust for schedules and line-ups, run probabilities and compare them with the latest odds.
GlobalPredict does that work for you, showing form, expected goals and matchup trends alongside the probabilities, so you understand the reasoning behind each pick instead of just copying it.
Use it as a second opinion on your own read of a match. Where you agree, you have confidence. Where you disagree, you have a reason to look closer.
Three Betting Markets That Benefit from Statistical Analysis
Football statistics can help assess several betting markets. The following examples explain how to approach three common options without treating any selection as guaranteed.
Over/Under Goals
Over/Under is a bet on total goals in a match. Over 2.5 Goals needs three or more, Under 2.5 needs two or fewer.
When both teams average over 1.5 xG for and against, expect goals. For example, Team A (1.8 for, 1.7 against) vs Team B (2.0 for, 1.6 against) blends to about 3.5 expected goals.
That makes Over 2.5 roughly a 68% chance, worth backing at odds above about 1.47, even if recent scorelines were low. Check team news first, as a missing striker lowers the total.
Asian Handicap: Evaluating the Difference Between Teams
Asian Handicap adjusts the starting score to balance mismatched teams.
- -0.5: your team must win.
- +0.5: you win if your team wins or draws.
- -1: your team must win by two or more; a one-goal win returns your stake.
- Quarter lines split your stake across two lines. With +0.25, a draw gives half a win. With -0.25, a draw loses half your stake.
When picking a line, check: team quality gap, home and away form, recent goal difference, xG difference and the opponent’s ability to avoid defeat.
Choose the line that fits your expected margin. If you expect a one-goal win, pick -0.5, since -1 is riskier. If you’re unsure a team will win, +0.5 still wins on a draw. Bigger rewards mean bigger risk, so make sure the odds beat the real chance of winning.
Match Result: Home Win, Draw or Away Win
The 1X2 market is a prediction of one of three outcomes: a home win, a draw or an away win.
Check: home and away form, xG difference, goals scored and conceded, and confirmed team news.
A home team that scores freely, defends well and is far stronger at home looks like the obvious pick, but always examines the other side too. An away team that creates chances and punishes weak defences can make the match tighter than the table suggests.
Draws are the hardest to call. They happen most often when sides are evenly matched, defend solidly and create few clear chances.
Estimate the real chances, then compare them with the bookmaker’s odds. A strong favourite is only worth backing if the odds offer better value than its actual chance of winning.
Conclusion: Trust the Numbers, Not Just the Pick
Stats won’t tell you who will win, but they show why a team is expected to win and how strong that case is.
- xG: chance quality
- Form: puts results in context
- Tactics and team news: show how the game might play out
- Probability: combines everything into one number, which only matters when compared with the odds
Nothing in football is guaranteed, so the goal is to find good value consistently, not to predict every winner.
Visit GlobalPredict for daily football tips with clear reasoning behind every pick.